
This video goes over how the screener works:
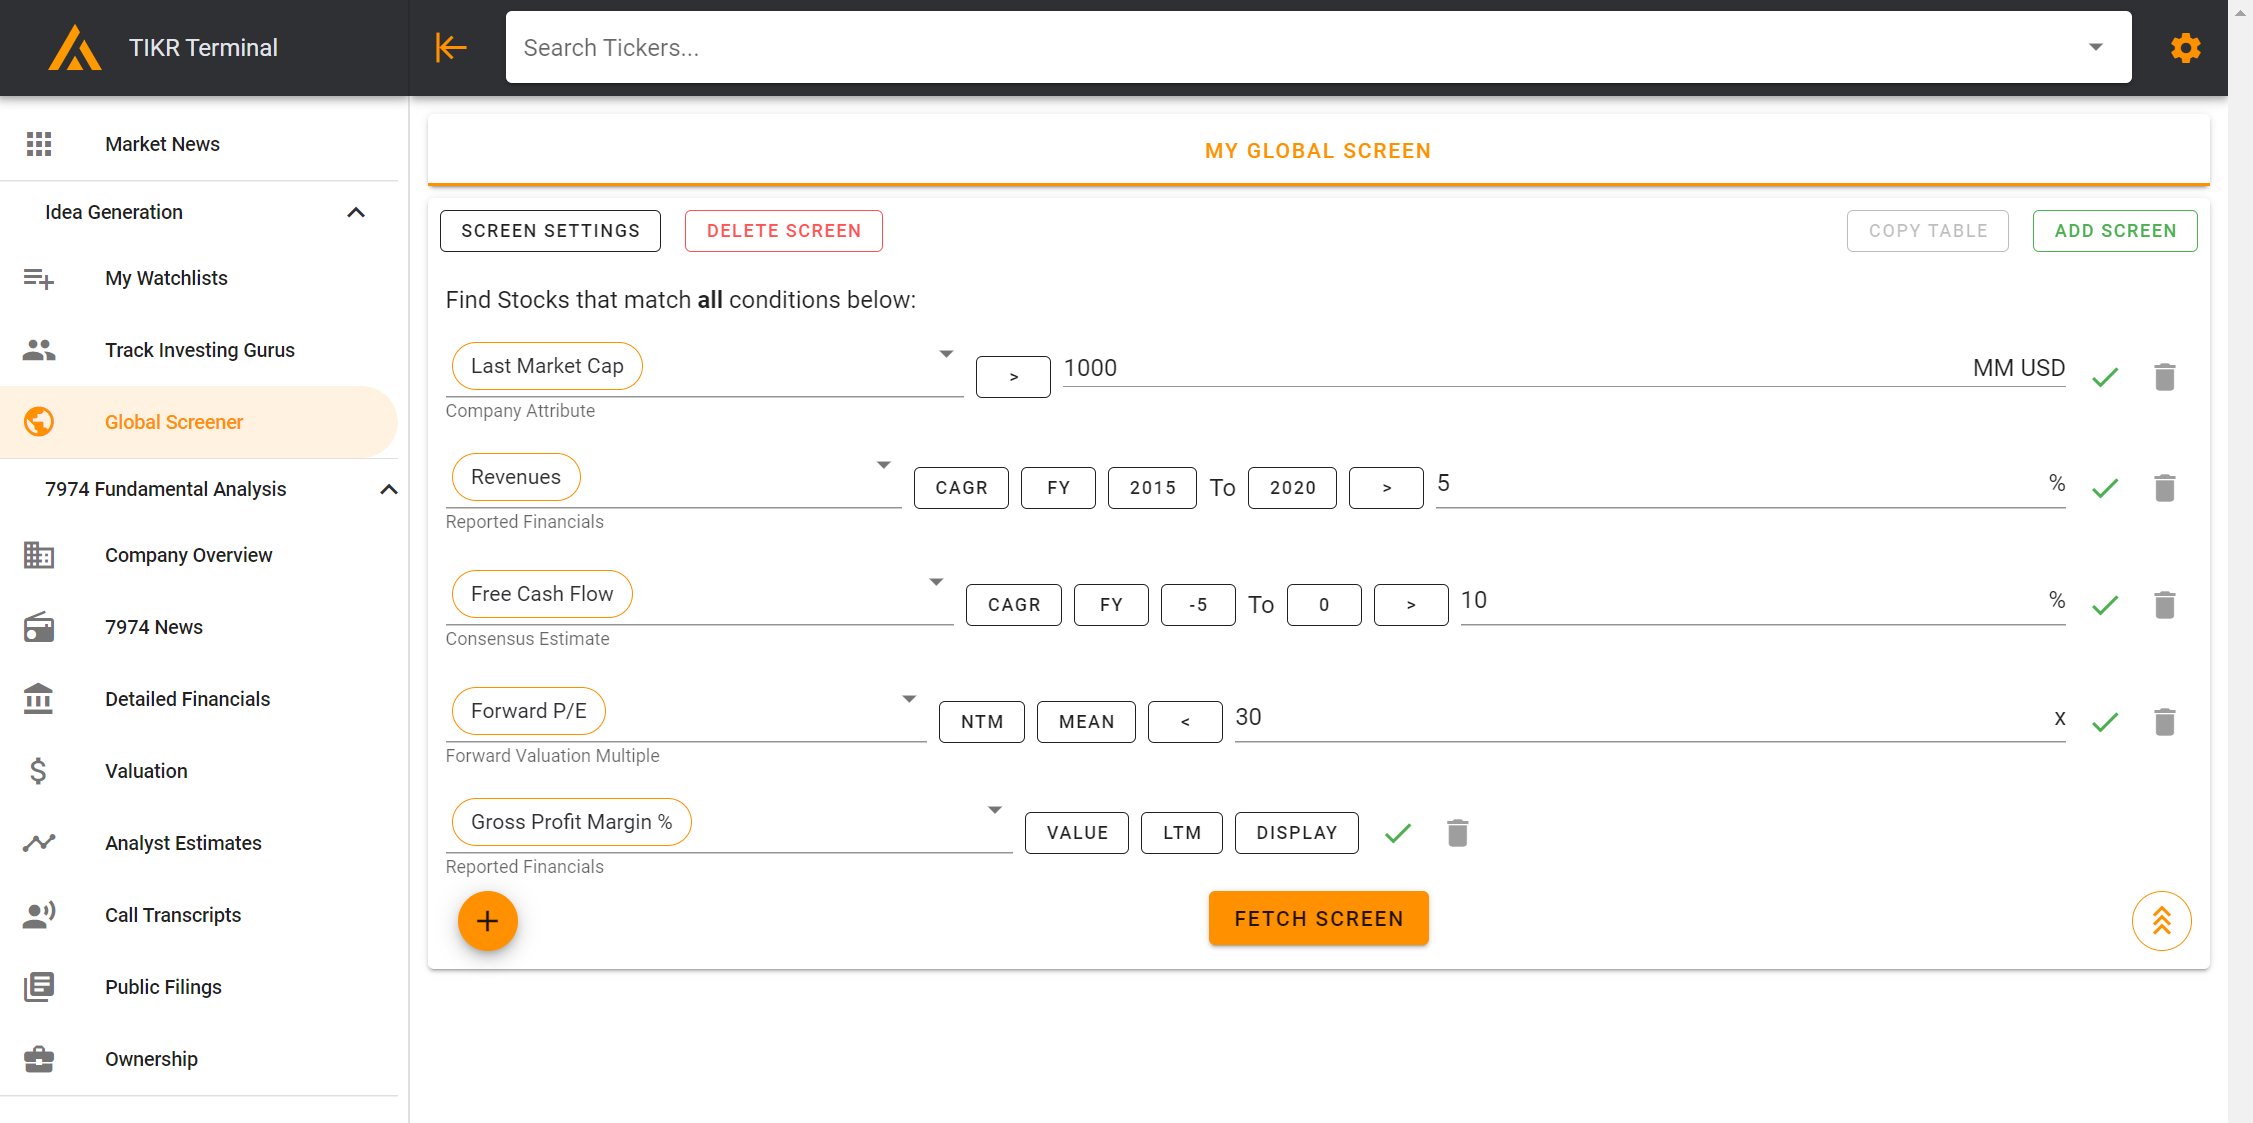
When you select the "Global Screener" from the left hand navigation bar for the first time, it will take you to our default screen. The global screener allows users to filter through stocks worldwide by region, industry, financials, ratios, valuation multiples, and more.
Users can view data by Value, % Change Year-over-Year, and CAGRs. They can view data by Fiscal Year, Calendar Year, Last Twelve Months, etc. Just click on the plus sign in the bottom left hand corner to add a new criteria. Then click "Fetch Screen" to run your screen.
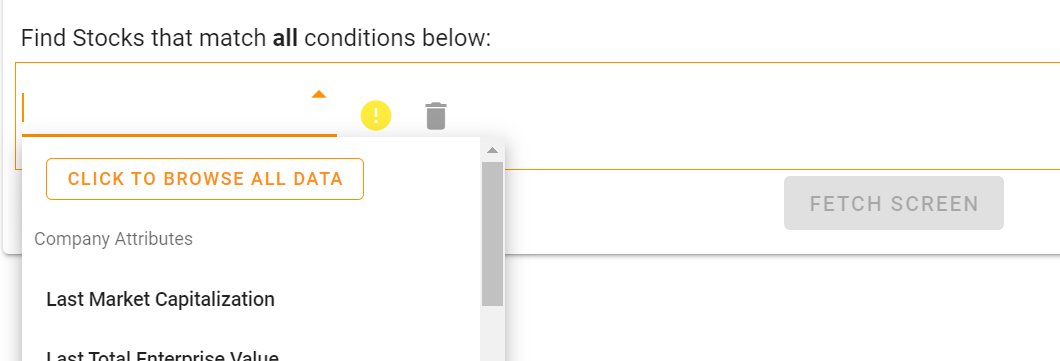
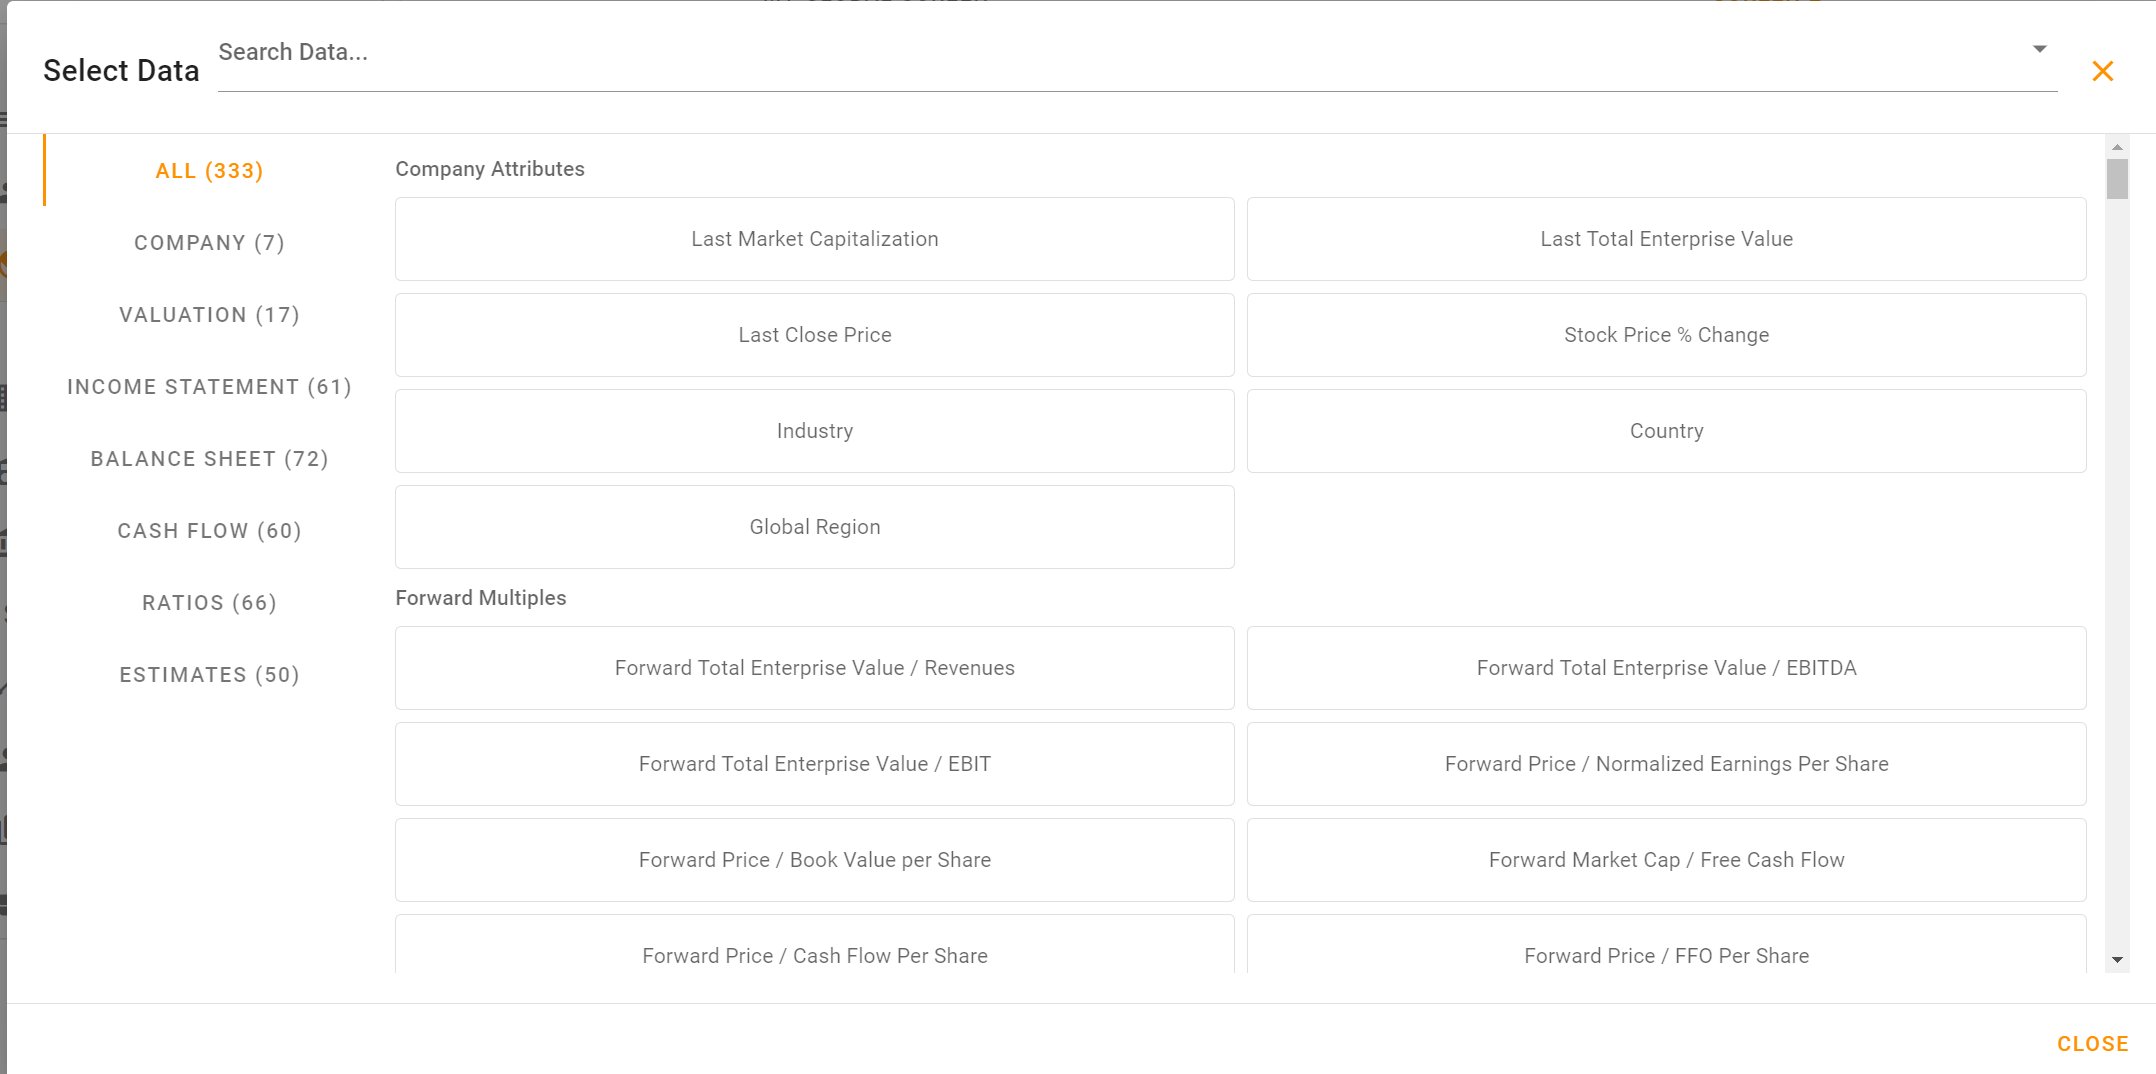
One helpful tool is to click on "Click to Browse All Data" in the drop down menu. This will allow you to more easily explore the screening criteria that you can choose from.
This is what the "Browse All Data" pop up looks like:
You can also add more screens by clicking on the "Add Screen" button in the top right hand corner. This will also automatically save your screens so that you can run them again in the future!
Exporting Screener Results
Due to restrictions from our data partners, users cannot download Screener results directly to Excel. However, you can still easily copy and paste results, up to 500 rows at a time, into Excel or any other spreadsheet tool. Simply highlight the rows you want, right-click to copy, and paste them directly into your sheet for further analysis.
This method gives you flexibility while still respecting the licensing agreements with our data partners.
Note on Preferreds and Bonds
TIKR currently focuses exclusively on common equities and does not provide data on preferred shares or bonds. This includes both in the screener and across the broader platform. We're always exploring ways to expand our coverage, and user feedback plays a key role in shaping future product improvements.
Comments
0 comments
Please sign in to leave a comment.